Data Science & ML Projects 

EPL Soccer Match Predictor

EPL Soccer Match Predictor

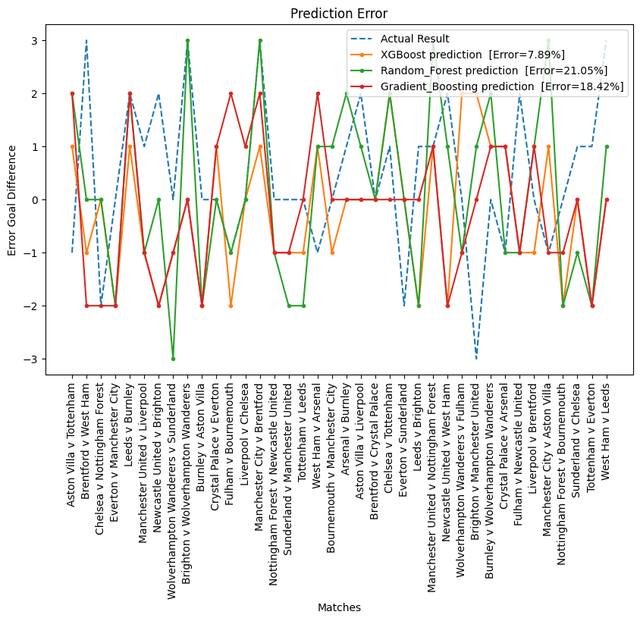
A machine learning model that predicts the outcome of EPL soccer matches using historical data (detailed match data from the Premier League 2025-2026 season) and various engineered features focused heavily on game state xG and shots data throughout the match. The XGBoost model was found to be the most accurate with an accuracy of over 92%.

Machine LearningPythonXGBoostRandom ForestGradient BoostingExploratory Data AnalysisData Visualization
Tableau Dashboard interactive passmap visualization of the 2018 UEFA Champions League Finals

Tableau Dashboard interactive passmap visualization of the 2018 UEFA Champions League Finals

Using Tableau, I created an interactive dashboard showing the pass map of the UEFA Champions League Finals of 2018. The dashboard uses public data provided by Rob Carroll and shows the heatmap and pass map of the players of both teams in the finals.

TableauData AnalysisData Visualization
ArcGIS Pro Mapping showing the wildfire hotspots in the Carolinas

ArcGIS Pro Mapping showing the wildfire hotspots in the Carolinas

Using ArcGIS Pro, I created a map showing the wildfire hotspots in the Carolinas. The map uses spatial statistics tools. The data for this project was provided by Clemson University.

ArcGIS ProData AnalysisSpatial StatisticsData Visualization
My Research Assistant

My Research Assistant

An end-to-end Retrieval-Augmented Generation (RAG) web app built to interactively answer questions related to my peer-reviewed publications. This project is an AI research assistant, which retrieves relevant responses from dense academic papers, researching Supermassive Black Holes, Active Galactic Nuclei (AGNs), Blazars, and QPO analysis of blazars.

PythonLangChainRAGNLPStreamlit
Tableau Dashboard showing the dynamic stats of the UEFA Champions League Finals 2018 and 2019

Tableau Dashboard showing the dynamic stats of the UEFA Champions League Finals 2018 and 2019

Using Tableau, I created a dashboard showing the dynamic statistics of the UEFA Champions League Finals of 2018 and 2019. The dashboard uses public data provided by Rob Carroll and shows the stats of the players and teams in the finals.

TableauData AnalysisData Visualization
Stock Market Forecasting

Stock Market Forecasting

S&P 500 represents the 500 most valuable companies of the US stock market. In this project, I utilize multiple statistical and machine learning models to forecast the market trend. See for yourself how different models stack up against eachother and how effective are they to forecast impending market crash.

PythonPandasHMMLearnTime Series Analysis
ML Classifications of Fermi-LAT Blazars

ML Classifications of Fermi-LAT Blazars

The raw data from the Fermi-LAT telescope is analyzed for classification of BLL and FSRQ types of blazars. Three classifier ML algorithms were trained for it, Decision Tree (DT), XGBoost DT (GBDT), and Random Forest (RF). The GBDT classifier was found to be the most accurate with accuracy >90%.

PythonXGBoostScikit-learnRandom Forest
Image style transfer using TensorFlow

Image style transfer using TensorFlow

Transfer the artistic style of a 'style' image to a 'content' image. In this project, I utilize a pretrained image layer filtering algorithm VGG19 to transform the style of an image.

PythonTensorFlowVGG19Deep Learning
ArcGIS Pro Mapping of Tigerbird Habitat in Saluda Basin

ArcGIS Pro Mapping of Tigerbird Habitat in Saluda Basin

Using ArcGIS Pro, I created a habitat map of the Tigerbird in the Saluda Basin. The map uses intersection, buffer, and other spatial analysis tools. The data for this project was provided by Clemson University.

ArcGIS ProData AnalysisSpatial AnalysisData Visualization
ArcGIS Pro Mapping of population density in the state of Georgia

ArcGIS Pro Mapping of population density in the state of Georgia

Using ArcGIS Pro, I created a map of the population density in the counties in the state of Georgia. The map shows a gradient color scale for the counties with population less than 100,000. The data for this project was sourced from the US Census Bureau. I also show the distribution of the total population in each county.

ArcGIS ProData AnalysisData Visualization

Hangman ML Solver

This project implements a N-Gram model to learn the word pattern from a dictionary to solve the Hangman Word Game. The N-Gram model is currently ~66% accurate when tested with training dictionary.

PythonN-GramNLPJupyter

Enhancing Periodicity Analysis Accuracy Through Phase Fold Amplitude Minimization (PFAM) Technique

In time-series astronomy, periodicity study is one of the most useful tools to understand an astrophysical system. Research papers on periodicity study often show phase-folded plots to emphasize the presence of periodicity. Depending on the quality of the data points, we can use the phase-folded light curves (LCs) to further enhance the accuracy of the observed period. I discuss an amplitude minimization of the phase-folded LC, which can enhance the accuracy of observed periods in astrophysical LCs.

PythonTime Series AnalysisAstronomyStatistics

Can Blazar flares in gamma-ray LCs be explained by jet angle and geometry?

In Prep...

PythonAstrophysicsSupermassiveBlack HolesData Analysis